
Developer Tools: A Practical Guide for Modern Web Teams
Developer Tools: A Practical Guide for Modern Web Teams
Developer tools are the software and built-in browser utilities that help you write, inspect, debug, test, and ship code faster. Some live inside your browser, like Chrome DevTools and Firefox Developer Tools. Others run in your terminal, CI pipeline, or cloud platform. This guide explains what each category does, how to use the core browser panels, and how to verify that your debugging setup is not leaking data or misrepresenting your environment.
What Counts as a Developer Tool?
Developer Tools: A Practical Guide for Modern Web Teams - What Counts as a Developer Tool?.
The term covers a wide range of software. It helps to sort them by where they run and what job they do.
- In-browser tools: Chrome DevTools, Firefox Developer Tools, Safari Web Inspector, and Edge DevTools. These inspect HTML, CSS, JavaScript, network requests, storage, and performance without leaving the page.
- Code and build tools: editors, linters, formatters, bundlers, package managers, and compilers.
- Testing and debugging tools: unit test runners, breakpoint debuggers, API clients, and browser automation frameworks.
- Deployment and operations tools: CI/CD pipelines, container runtimes, log aggregators, and monitoring dashboards.
- Security and privacy tools: vulnerability scanners, dependency auditors, and browser-based leak and fingerprint checkers.
Most developers use a mix. A frontend engineer might live in the Elements panel, while a platform engineer spends more time in logs and pipelines.
How to Open Browser Developer Tools
Developer Tools: A Practical Guide for Modern Web Teams - How to Open Browser Developer Tools.
Every major browser ships with a developer console. The shortcuts are similar across platforms:
- Windows and Linux:
Ctrl + Shift + IorF12 - macOS:
Cmd + Option + I - Menu path: Chrome and Edge use More tools → Developer tools; Firefox uses More tools → Web Developer Tools
- Right-click method: Right-click any element and choose Inspect to jump straight to its markup
Safari hides its tools by default. Enable them under Safari → Settings → Advanced → Show features for web developers.
The Core Panels You Will Actually Use
Developer Tools: A Practical Guide for Modern Web Teams - The Core Panels You Will Actually Use.
Elements (Inspector)
The Elements panel shows the live DOM and the CSS rules applied to each node. You can edit HTML, toggle styles, and test layout changes instantly. Nothing you change here is saved to disk, which makes it a safe sandbox for experiments.
Useful tricks:
- Right-click a node to Edit as HTML or Copy selector.
- Click a CSS declaration checkbox to see what happens when a rule is removed.
- Inspect the box model to debug unexpected spacing.
Console
The Console runs JavaScript against the current page and reports runtime errors. It is the fastest way to test an expression, inspect a variable, or confirm whether a selector matches.
document.querySelectorAll('a[href^="https"]').length
If a script fails silently, the Console usually explains why before you open a debugger.
Sources (Debugger)
The Sources panel lets you set breakpoints, step through code, and watch variables. Breakpoints pause execution at a specific line so you can inspect the call stack and scope. This is far more precise than adding console.log statements throughout a file.
Network
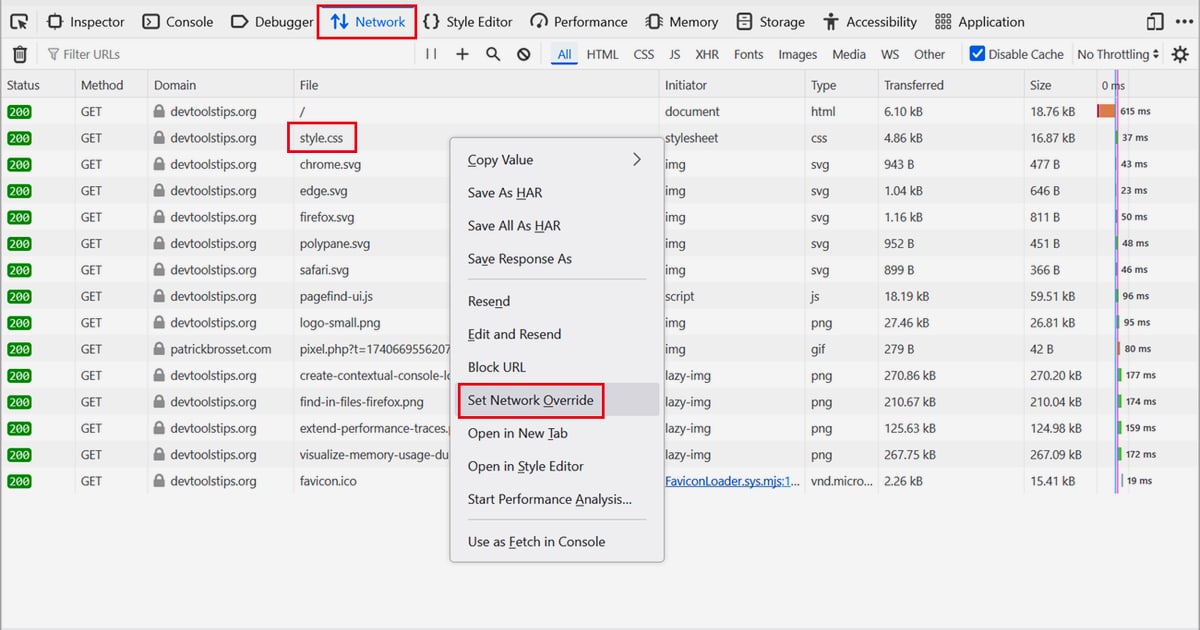
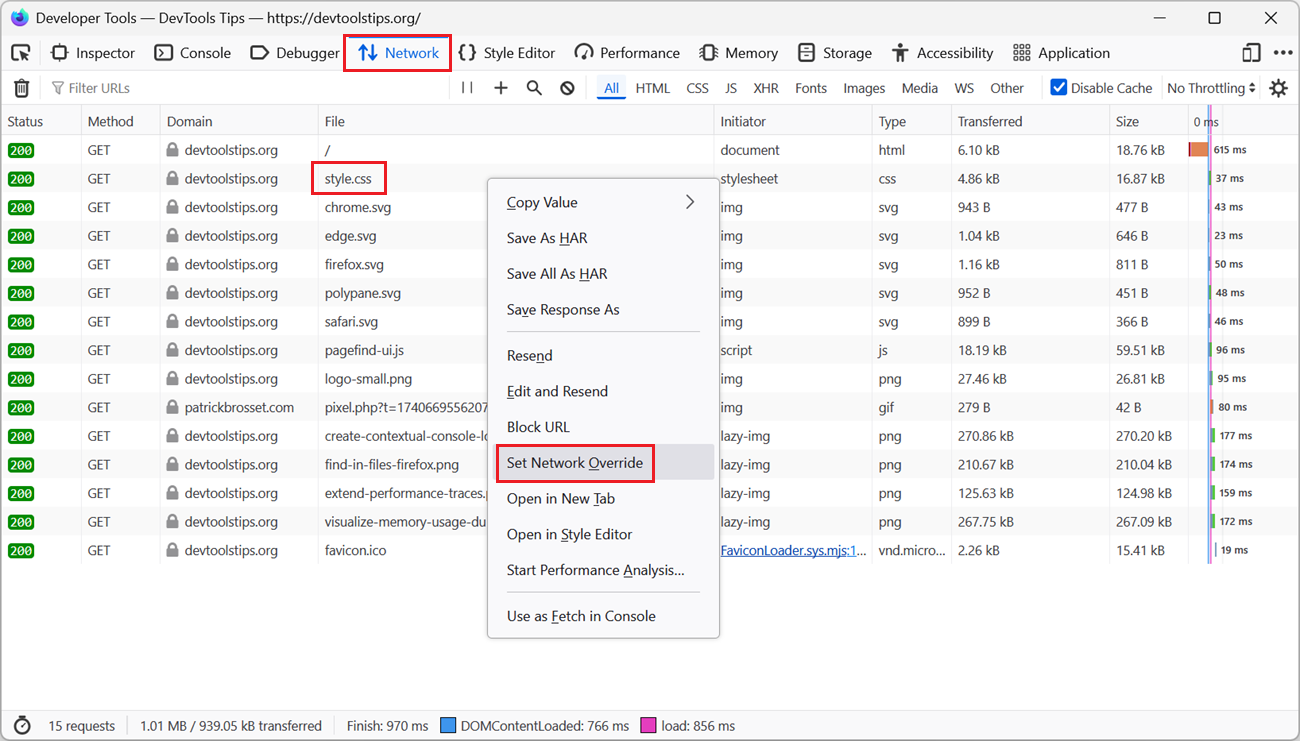
The Network panel records every request the page makes. You can inspect headers, response bodies, timing, and status codes. It is essential for debugging CORS errors, slow assets, and failed API calls. You can also throttle the connection to simulate slow networks.
Performance and Lighthouse
The Performance panel records traces so you can find long tasks, layout shifts, and rendering bottlenecks. Lighthouse, available inside DevTools, audits accessibility, best practices, and performance metrics like Largest Contentful Paint (LCP) and Cumulative Layout Shift (CLS).
Debugging Beyond the Browser

Developer Tools: A Practical Guide for Modern Web Teams - Debugging Beyond the Browser.
Browser tools cover the client side, but production issues often start elsewhere. A few habits help:
- Reproduce with real conditions. Use network throttling and device emulation before assuming a bug is server-side.
- Check headers and payloads. The Network panel often reveals a mismatch between what the frontend sends and what the API expects.
- Verify the environment. User agent strings, client hints, and geolocation data can change behavior between browsers and regions.
When a bug depends on browser identity or network configuration, a user agent parser or a BrowserScan setup check can confirm what the server actually sees. This is especially useful when debugging bot detection, localization, or proxy-related issues.
Testing Privacy and Fingerprint Behavior
Developers increasingly need to understand how their own browsers and test environments appear to the outside world. Fingerprinting, DNS leaks, and WebRTC leaks affect both privacy and the accuracy of debugging.
A browser fingerprint test shows which attributes — canvas rendering, fonts, screen size, timezone, and more — combine to identify a browser. If you are testing a VPN, a proxy, or a multi-account workflow, verifying that your real IP is not exposed is part of a reliable setup. BrowserScan offers free, browser-based checks for fingerprints, DNS and WebRTC leaks, and IP geolocation, which makes it a practical companion to standard DevTools when you need to validate network identity.
For a broader look at how browsers protect users, see the guide to browser security threats and tests.
Choosing the Right Tool for the Job
| Task | Best tool |
|---|---|
| Inspect or edit DOM and CSS | Elements panel |
| Run quick JavaScript snippets | Console |
| Step through logic with breakpoints | Sources panel |
| Debug API calls and headers | Network panel |
| Measure load and rendering performance | Performance panel, Lighthouse |
| Verify fingerprint or leak exposure | BrowserScan fingerprint and leak tests |
| Audit dependencies for vulnerabilities | Package manager audit commands |
Start with the browser panels for anything client-side. Move to specialized tools only when the problem clearly crosses into network identity, security, or infrastructure.
Common Mistakes and How to Avoid Them
- Editing in DevTools and forgetting to save. Changes in the Elements panel are temporary. Copy them back to your source files.
- Ignoring the Network panel. Many "JavaScript bugs" are actually failed requests or wrong response shapes.
- Testing only in one browser. User agent differences, client hints, and rendering engines can change behavior.
- Skipping privacy checks. If you use a VPN or proxy during development, confirm it is not leaking DNS or WebRTC data.
- Leaving breakpoints enabled. Forgotten breakpoints can make a page appear frozen.
Related reading
- Reverse Geocoding: Convert Coordinates to Addresses - Learn how reverse geocoding turns latitude and longitude into street addresses, how accuracy works, and how to protect your location privacy online.
- Privacy Tools: What They Are and How to Verify Yours - A practical guide to privacy tools: browsers, VPNs, DNS, password managers, and free tests that verify your setup actually protects you.
- NordVPN Pricing Explained: Plans, Costs, and Real Value - Compare NordVPN pricing across monthly, yearly, and 2-year plans, see what each tier includes, and learn how to verify your VPN actually protects you.
Sources and further reading
- Chrome DevTools - Debug and optimize your web applications with Chrome DevTools.
- What are browser developer tools? - Learn web development | MDN - Every modern web browser includes a powerful suite of developer tools. These tools do a range of things, from inspecting currently-loaded HTML, CSS, and JavaScript to showing which assets the page has requested and how long they took to load. This article explains how to use the basic functions of your browser's devtools.
- What are Developer Tools? - What is Developer Tools how and why businesses use Developer Tools, and how to use Developer Tools with AWS.
FAQ
What are developer tools?
Developer tools are software utilities that help developers write, inspect, debug, test, and deploy code. They include browser DevTools, code editors, debuggers, test runners, and CI/CD platforms.
How do I open developer tools in Chrome?
Press Ctrl + Shift + I on Windows or Linux, or Cmd + Option + I on macOS. You can also right-click a page element and choose Inspect.
What is the difference between the Console and the Sources panel?
The Console runs JavaScript and shows errors in real time. The Sources panel lets you set breakpoints and step through code line by line for deeper debugging.
Can developer tools check my privacy?
Standard DevTools show network and storage activity, but they do not measure fingerprinting or leak exposure. Dedicated browser-based tests are better suited for that.
Do I need to install anything to use browser developer tools?
No. Every modern browser includes them. Some advanced privacy and fingerprint checks also run entirely in the browser without installation.
Conclusion
Developer tools are not a single product — they are a layered toolkit. Browser panels handle inspection, debugging, and performance. Editors, test runners, and pipelines handle the rest of the lifecycle. When your work touches network identity, VPNs, or multi-account testing, add a privacy check to your routine so you know exactly how your browser appears to the outside world. Start with the built-in panels, then reach for specialized tools only when the problem demands them.